

How to make Bike-Sharing work in the 21st century?
Norwegian scientists and the largest norwegian mobility sharing company answer this question with a collaborative project. Recently this collaboration got funded by the Research Council of Norway with a part of 1 million Euros (NOK 10 Mio). The project aim is to develop an optimization model called “Pilot-T” to increase the efficiency of rebalancing-teams by 30% and the overall lifetime of shared bikes by 20%. The model predicts availability at stations and the required bike reallocation. Predictions are based on the relevant factors for the volatile demand which is the same approach we have with Available-Citybikes.
We are convinced that the norwegian project is an important contribution to progressive urban bike-sharing. If you are interested in mobility, smart urban cities and the respective plans to improve bike-sharing. I can highly recommend to read the full article in the Norwegian SciTech News.
Status Quo Available-Citybikes
In the last blog article I wrote about my personal experience with unavailability at StadtRad. We asked ourselves on which degree this subjective impression is an objective and systematical problem.
Therefore we analysed the publicly available dataset of StadtRad in the last year (2021). I am very grateful for the great data-collection at Urban data hub and the documentation. I plead guilty to have not read the docs before but scraped the dataset with a json-scraper script written in a fraction of a day. To any developer who is doing the same (I know we all have limited time to read docs), there will be a moment you might want to talk with your data-provider directly and they might ask questions, just be prepared.


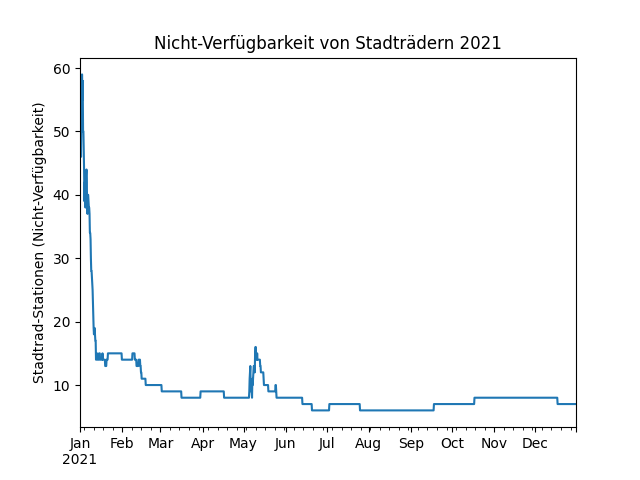
Not surprising the results show that the specific availability is rather bad, but then again the overall availability is good.
In detail we can see within the Flop 10 stations an unavailability of about 100 days mean in 2021. The Flop 1 being close to 160 days which is almost half the time of the entire year.
The bottom chart describes the overall availability. Over the time course 9 stations mean are unavailable or in other words at any given moment in the last year in average 9 stations are bikeless. Considering the whole StadtRad infrastructure with a total of 296 stations we consider 9 unavailable stations as a small fraction.
To sum up our learnings:
- it is very interesting that specific and overall availability are showing diametrical opposing results.
- we shall focus more on the individual reasons for bad availability at specific stations rather than search for a greater reason affecting each and every station.
If you wondered why the graph shows a gigantic spike on the very left in January until now this effect remains unclear to us. Such a high demand is uncommon for a month in the winter, so for the moment we assume a test- / technical error.
Further project steps
The current dataset helps us to get an intuition about the relevant factors of availability. We can map dataset phenomena to relevant factors e.g. lower availability in summer → seasonal factor or bottlenecks at rush hours → time of the day. This mapping is an important step to select the most relevant factors for our neural network.
Unfortunately the current dataset also includes significant errors. These errors increase our efforts to analyse more specific socio-economic patterns and is a high risk to train an error prune neural network. To overcome this challenge we approached the operational stakeholder Deutsche Bahn Connect and the contracting authority Behörde für Verkehr und Mobilitätswende of StadtRad. We hope to achieve an agreement to work with their dataset soon and going ahead with the implementation of the first neural network.