

StadtRad Hamburg: A data-science perspective
We took part at the HHack+Ride Hackathon and continued our work on the project Available-Citybikes. It was an awesome event! A special thanks to Vinh, Roza, Max and Izabel who joined our project while the Hackathon. Together we achieved the 2nd place in Innovation.


But even more importantly we met Ingmar from Deutsche Bahn who handed us the dataset of StadtRad trips from 2021 and 2022. This finally enables us detailed and accurate data examinations.
So let’s dive right in! 🏄
Head to toe
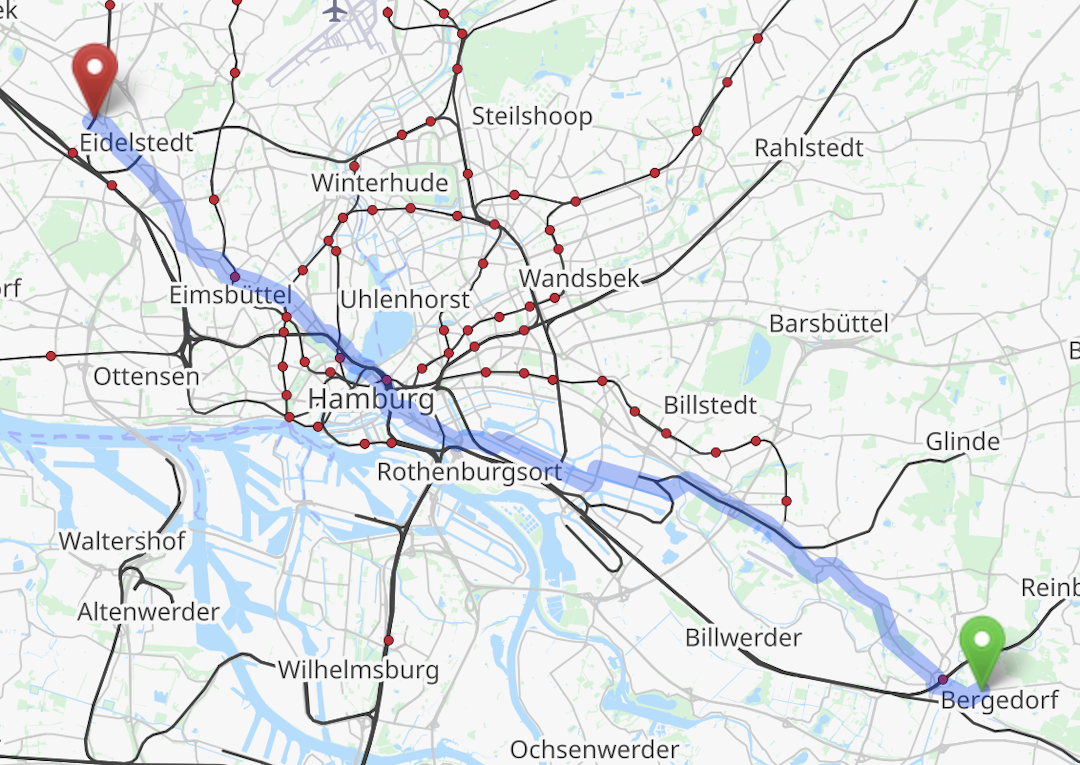
What can we do with this data? We know the pick-up station, drop-off station, the start time and end time. My first curiosity brought me to build a map of frequented routes between stations. Thicker lines show a more frequented connection, thinner vice versa. What if there is no line? Well there are still some trips, but less than 500 trips / year and this is the random threshold that I picked. You might ask why? - I chose 500 trips / year as a good trade off between performance and usability while not loosing too much information. Bias Limitation: Therefore it might not represent the regularities and patterns of all bike connections.
Some interesting observations I had:
- Trips are less frequent in “well-situated” districts
- Trips are usually frequent in “low-situated” districts
- Many frequent routes are in the city centre
- Stations in the suburbs are less frequently used
- but Stadtrad is frequently used in Harburg
- Wilhelmsburg → Goldbekplatz is the most frequented route
The Cliché StadtRad trip
How does a stereotypical StadtRad trip look like?
- Distance: 2,95km
- Duration: 37 minutes (30 min free → equals to 0,56 € at the current pricing)
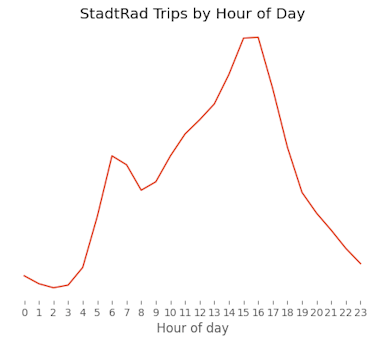
- Dayhour: Between 15-16h → Leisure trip

Flop “Supply and Demand” stations
Following I was curious to conduct the general imbalance between demand and supply on a station level.

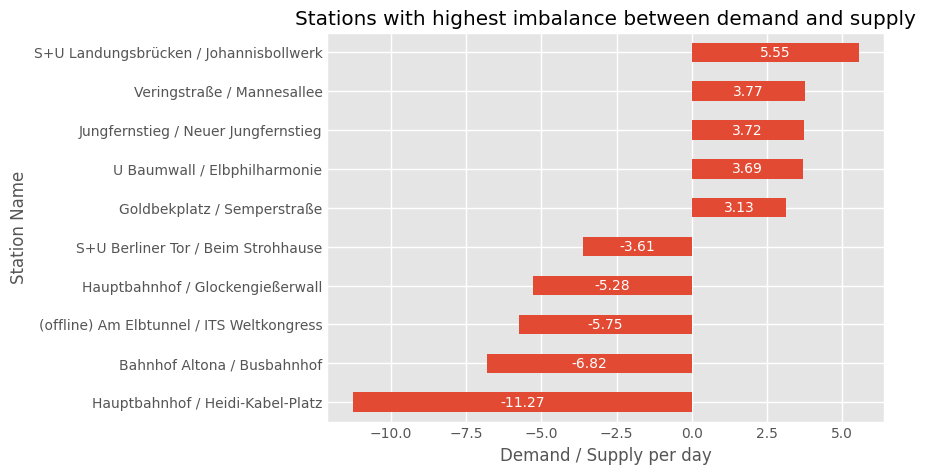
The data was optained by subtracting the bike pick-ups of the drop-offs per station. With other words the bar chart expresses how many more bikes are taken from a station than returned. A perfect station has a demand / supply per day of 0 and is therefore balanced. The chart shows the 5 most demanded and 5 most supplied StadtRad stations.
Interpretation
Surely the results can be interpreted with different perspectives. One perspective described in scientific papers is the role of shared bikes solving the last mile problem in harmony with other means of transport. I think we can use this perspective to interpret the relatively higher demand at Hauptbahnhof and Bahnhof Altona People arrive at Hauptbahnhof (central train station Hamburg) and Bahnhof Altona by a train or bus and choose to pick-up a StadtRad for the last mile trip to go home. Afterwords bikes are not returned to Hauptbahnhof and remain in residential areas.
Contrary Landungsbrücken, Jungfernstieg und U Baumwall are stations with relatively higher drop-offs. The adjacent neighborhood is the harbor loved by real Hamburger’s and tourist for the variety of cultural events, restaurants and Hamburg’s most famous sightseeing spots. Therefore we can interpret the relatively higher supply by people’s use of transportation for social participation. In this example people arrive with a StadtRad and depart with other means of transport reasoned by darkness, more or less alcohol consumption or mutual commute. The reasoning could be an interesting field for further and more in-depth research in the future.
Interesting is the total amount of demand / supply of bikes per day - the amplitude. The 11 bikes averagely missing daily at Hauptbahnhof need to be rebalanced somehow to not end up with a station without bikes.
Rebalancing usually takes place by a service provider who is picking up bikes at an over-supplied station with a van and drops them at an under-supplied station. Assuming that a van can transport 6 bikes results into two trips every day to cover just the demand at Hauptbahnhof. These rebalancing-trips are costly, tedious and contradict the sustainability of bikes.
Operational changes in cities like Paris have shown improvements. Paris shared bikes company incentive users to drop-off and pick-up at stations with vouchers. But I am not getting deeper into operational details as there are others with more expertise in this field of expertise.
To conclude, the result show a structural demand-supply problem on the stations level. This further emphasises the findings in my first blog article. We conducted the average demand-supply over a long timeframe of two years. Average is a good indicator for a long-term trend, but has the downside of averaging situational volatility out. Many studies show that situational factors like social events, constructions and weather strongly moderate the actual availability. That let us expect even worse actual availability than examined by average supply / demand here. I am curious to cover the situational perspective and the influence of situational factors on the demand in future blog article.
Awards
Since some of the data is really outstanding I suggest we take some time and honour three interesting outliers with Awards.
Bravest StadtRad-er 🏆
- With a distance of 37,6km (air distance station to station)
- In a time of 5:30h

Laziest StadtRad-er 🦥
- With an incredible trip duration of 219 days 23 hours 42 minutes and 04 seconds
- Translates to costs of 25.340,16€

Most street credibility: StadtRad-Gang 🥷🏼
As a gang of eight people on Thursday, 24st of February 2021 at U Mundsburg /Schürbeker Straße → U Mundsburg / Schürbeker Straße from 21:30h-22:00h
The next blog article will be out soon! It will be about my “Roadmap to AI” with useful tips and recommendation for you about learning Artificial Intelligence theory and application.